Stevenson Weather Data
The Stevenson screen is an enclosure for meteorological equipment invented by Thomas Stevenson. Over the years they have been modified to improve the reliability of the measurements taken within. There have been several different Stevenson screens at the site over the years. At one time there were even two, one of which housed a hydro-thermograph. As time goes on of course systems break down are too expensive to replace. This what happened to the Thermograph and the Stevenson screens since they were wooden designs fell to the elements and rotted away. You can now buy plastic ones which won't rot of course but will still eventually fall victim to the sun. Also more more modern ones have black interiors which we are told don't effect the readings.
You will find the weather averages recorded by the Stephenson screen in the tables below. The data was collected from 1955 onwards.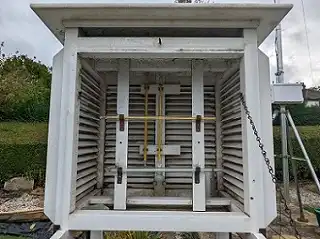
These includes Humidity, Maximum and Minimum temperatures, Wind speed, wind gusts, Soil Temperature, Air pressure and Rainfall. The humidity is recorded via a wet and dry bulb. Soil temperatures measured at one foot. Due to EU regulations you cannot purchase Maximum Thermometers any more due to Mercury. So far a suitable replacement hasn't been found by the companies supplying Met office equipment. I had to purchase another digital thermometer which also does Minimum and is Nist Certified.. This is very accurate more so then the Davis weather station. I recently also moved the Davis temperature and humidity sensor into the screen which means I no longer need to replace the Davis fan every year and also the batteries.
At the bottom of the page you'll find links to the Monthly summaries from 1998. Averages since 1955 which include Rainfall, Maximum temperature, Minimum Temperature and the average. Within those you'll also find the warmest and coldest months and the wettest months. Plus the warmest, coldest and wettest years. There are links to Daily average high, Low and average for the years 1961 to 1990 and a daily temperature versus the daily average from 1961 - 1990. I have also done the same for the years 1991 - 2020 so you can have a good comparison of data in regards to climate change. The graphs show the temperature range per day and where they fit in regard to average temperature expected for the day. This gives a quick visual as to whether the days stand in regard to averages.
There's an ongoing change to this web page and I'm moving from excel charts to charts.js which provide a much better clearer chart presentation. From the weather charts you also have links to monthly summaries and yearly extremes. I'll be next working on the Monthly averages followed by the averages from 1955.
The Davis weather station also runs from midnight to midnight so this will show slight differences from the data measured from the Stevenson screen. Also note that digital respond quicker to temperatures changes so it's possible the Stevenson data may miss some peaks and troughs. Since I've moved to digital sensors to the Maximum and Minimum this no longer applies.
A new set of Maximum, Minimum,Dry and Wet bulbs have been bought over the last couple of years. This means the Davis Maximum isn’t been used any longer. However the values tend to match the values recorded in the Stevenson screen. This allowed me to reconstruct some of the data that was missing from the 2004 data sets due to illness.I will be slowly adding further data sets although this a time consuming business.
Stevenson Screen Data and the Monthly Summaries from the Year 1998 onwards
| Stevenson Screen Data 2000 Onwards | ||
|---|---|---|
| Year | Year | Year |
| 1994 | 2006 | charts and Summaries | 2018 | charts and Summaries |
| 1995 | 2007 | charts and Summaries | 2019 | charts and Summaries |
| 1996 | 2008 | charts and Summaries | 2020 | charts and Summaries |
| 1997 | 2009 | charts and Summaries | 2021 | charts and Summaries |
| 1998 | charts and Summaries | 2010 | charts and Summaries | 2022 | charts and Summaries |
| 1999 | charts and Summaries | 2011 | charts and Summaries | 2023 | charts and Summaries |
| 2000 | charts and Summaries | 2012 | charts and Summaries | 2024 | charts and Summaries |
| 2001 | charts and Summaries | 2013 | charts and Summaries | 2025 | charts and Summaries |
| 2002 | charts and Summaries | 2014 | charts and Summaries | 2026 | charts and Summaries |
| 2003 | charts and Summaries | 2015 | charts and Summaries | 2027 |
| 2004 | charts and Summaries | 2016 | charts and Summaries | 2028 |
| 2005 | charts and Summaries | 2017 | charts and Summaries | 2029 |
Stevenson Screen Data and the Monthly Averages from the Year 2000 Onwards
Weather Averages including Hottest, Coolest, Wettest and Driest Months 1955 Onwards. Daily Averages 1961 - 1990 and 1991 - 2020.
| Stevenson Screen Monthly Averages 1955 Onwards | ||||
|---|---|---|---|---|
| Rainfall | Temperature | Average daily Temperatures 1961 - 1990 | Average Daily Temperatures 1991 - 2020 | Winds speed and Gust |
| Rainfall | Maximum Temperature | Daily Average High 1961 - 1990 | Daily Average High 1991 - 2020 | Wind Speed |
| Minimum Temperature | Daily Average Low 1961 - 1990 | Daily Average Low 1991 - 2020 | Gust | |
| Average Temperature | Daily Average 1961 - 1990 | Daily Average 1991 - 2020 | ||